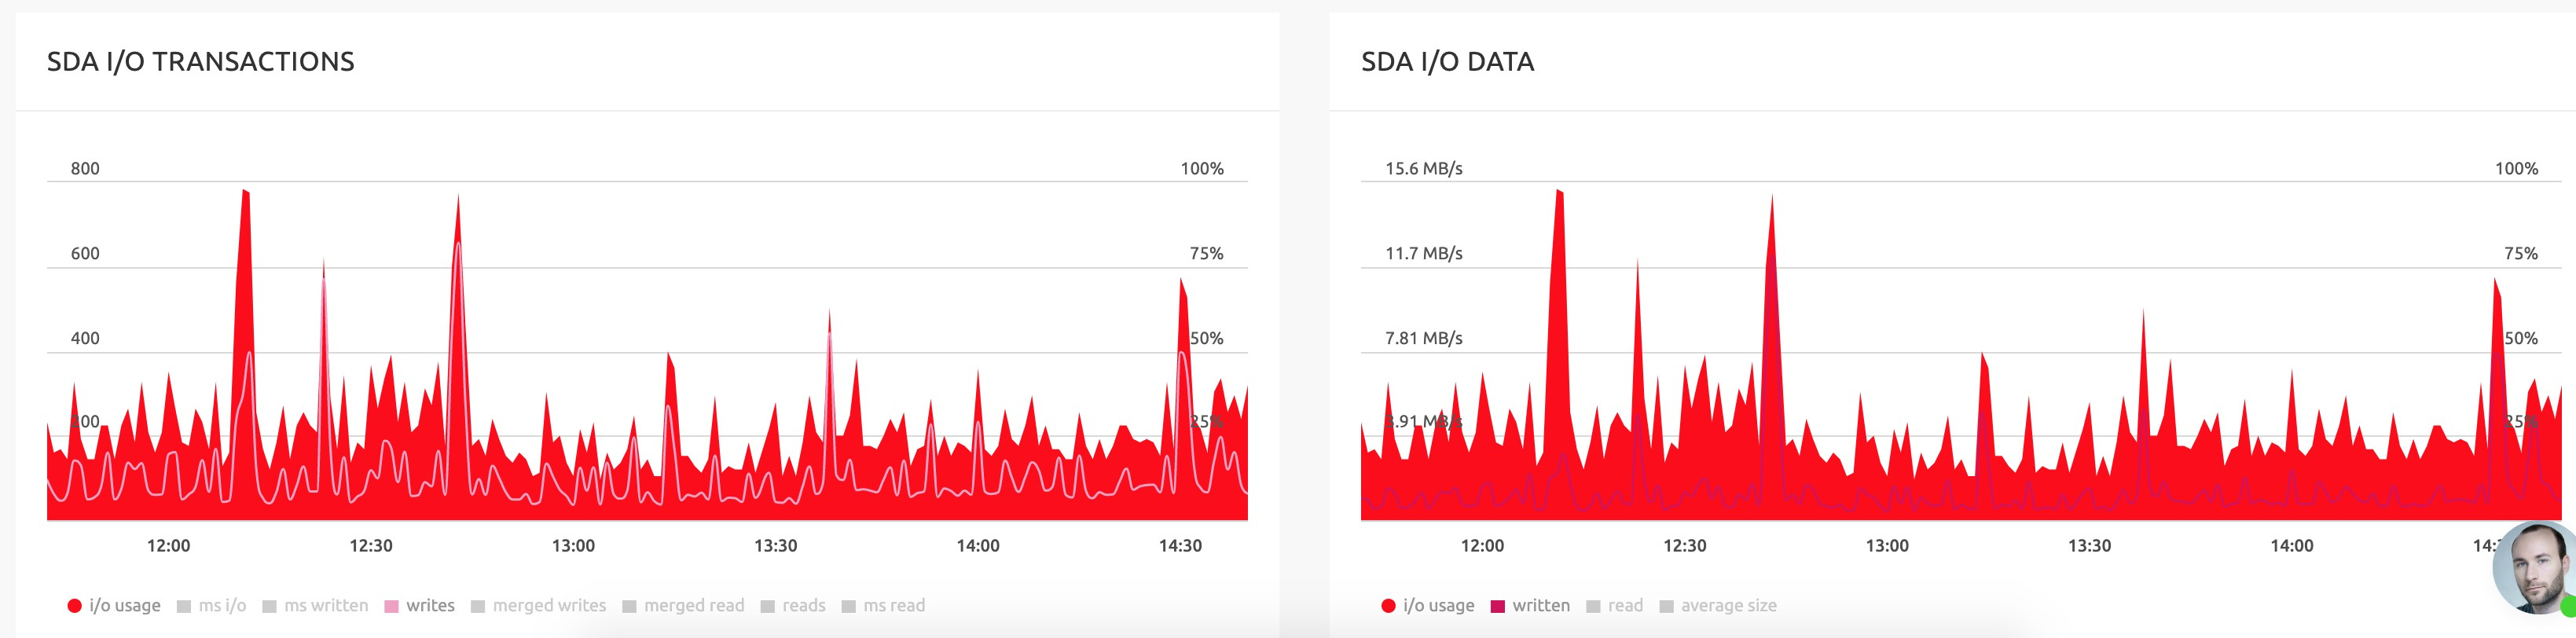
I have a server and I’m seeing these spikes:
Nginx, php-fpm, mariadb. No traffic spike, no network problems, no cron running at the time.
This is a VM on top of Proxmox with ZFS (HDD), no limitations are configured. How to trace the problem?
I have a server and I’m seeing these spikes:
Nginx, php-fpm, mariadb. No traffic spike, no network problems, no cron running at the time.
This is a VM on top of Proxmox with ZFS (HDD), no limitations are configured. How to trace the problem?
The spikes are up to 15MB/s and 600IOPS for a short period. I wouldn’t really bother, especially if you are on ZFS and have no real problem with the disk access times. Maybe it’s just ZFS moving RAM cache to the drive or Proxmox writing various logs in that period.
It’s causing website downtime, no more than 20 seconds.
What are your magical kernel tuning params? What’s your scheduler? Are you running deadlock?
This is what I use on my KVM node:
vm.dirty_background_ratio = 7
vm.dirty_ratio = 12
vm.swappiness = 12
Granted, this is my personal node, and it’s an ugly 5xxx from the Reagan era, but even with my usual security stuff, monitoring, and cron jobs, I don’t have anywhere near that kind of burst.
There’s a utility named “iotop” that should help you find the cause to the spikes.
That’d be my choice as well.
Thanks. iotop will be useful in real time, right? But this happens so fast that when I log in to the server, everything is already normal.
You need to monitor it when this occurs. Spikes happen, but you need to track it back.
It’s possible something like syssnap might catch it. I mean monitoring systems all work on polling as far as I know so it’s surely happening for long enough periods of time that your current monitoring picks up on it.
My logic may not be sound.
Maybe try something like this: How to Monitor Disk IO on Linux Server with Iotop and Cron - BinaryTides. After you see it spike in your monitoring, check the iotop logs you’ll be keeping to track down the cause.
I’d also suggest setting up sar, if you haven’t. It’ll help you break it down further- depending on your virtualization. ioperf/iotop/binfalse may all work for you - just need to peg it down. Make cron send you a note, et al…
apt-get install glances
glances
apt-get install iotop
iotop
What do these do for your node specifically?
It’s basically a way to control page writes to the disk and RAM. The lower the number, the faster it’s going to start thrashing a bit more, but it’s going to ensure things aren’t in an ugly state. I run softraid on a lower end CPU, so I am a bit paranoid about my data safety.
I also want the most performance possible from this ~12 year old hardware, so if I/O isn’t being an issue, I’ve got swappiness set very low, so it won’t page out if unnecessary.
I’d definitely recommend Netdata to help track it down. One of the charts is disk IO per application, which should help you figure out where the disk activity is coming from.
By default it’ll keep about an hour of data at 1 second granularity (consumes ~10 MB RAM for one hour of data for 1000 metrics) which should be sufficient to track down something like this, but you can increase that if needed, or log the data to Prometheus for long-term storage.
Here’s an older thread about it: Netdata - Awesome System Monitoring Tool
NetData works very well, been using it last month
Secondly, are you running this on the VMs and / or the host?
Hypervisor.
Interesting, why not inside the VMS?
Glances is awesome, InfluxDB is blazing fast, while still low on resources.