Lol I like your fan placement / rigging
1 Like
yeah 120mm and 135mm fans ![]()
I only have one machine which isn’t used for desktop usage, it is;
- i4770k (for motion detection on a lot of cams)
- 2x 4TB H/W RAID 1
- Blue Iris for IP Cams, Windows
1 Like
Nice! I’m planning on setting up a bunch of IP cams after the move in a few months. Was planning on running ZoneMinder on a server hidden somewhere in the house (because if an intruder finds it – bye bye evidence).
What IP cams do you use and would you recommend them?
Yes, hiding it is a good idea, a 2nd remote recording (low cpu is fine if you just record all the time on the remote machine and don’t use motion detection) is also a good idea if you have fast internet at home.
All the cameras I have work well, I like them.
I have 8 of these;
https://www.amazon.com/gp/product/B0159ZJYF2/ref=oh_aui_search_detailpage?ie=UTF8&psc=1
1 of these;
And 4 of these for the cage at work which I also record at home and remotely;
http://www.hikvision.com/us/Products_1_10533_i7579.html
I’ve not looked at zone minder, I use blue iris just because that was what looked good at the time and it gets constant updates. It is CPU bound though if you enable motion detection on all the cameras.
2 Likes
I’m using unifi cameras at home and host the controller on a VPS ![]() the cameras are creeping up in price thou
the cameras are creeping up in price thou ![]()
Yeah IIRC you have to use unifi controller with unifi cameras? If so, I wouldn’t want to be vendor locked.
I used to have home servers, but it was so much quieter and easier to just send them to a datacenter.
2 Likes
Yeah you do. And fair enough, we resell a lot of unifi kit so it makes sense. As far as I know the hikavision stuff uses it’s own controller too ![]()
They probably have one, but the IP cams are open standard and can be used in any ipcamera software.
1 Like
I still have a i3-6100/8gb ram/12tb hdd space running for plex and timemachine. Not really using plex that much anymore but it’s a very low power machine so I’ll let it idle with the backups.
1 Like
Have a couple at home, SC813’s & thin clients.
1 X E3-1220 running pfsense
1 X E3-1230 running Windows & security camera software
2 X Wyse thin clients
1 X Raspberry pi
First two are self explanatory on what they do. One thin client runs:
Grafana
Graphite
InfluxDB
Sensu/Redis/Rabbit
Second thin client runs RTL-AMR & a USB RF dongle.
Raspberry pi runs a few gpio temp & humidity sensors.
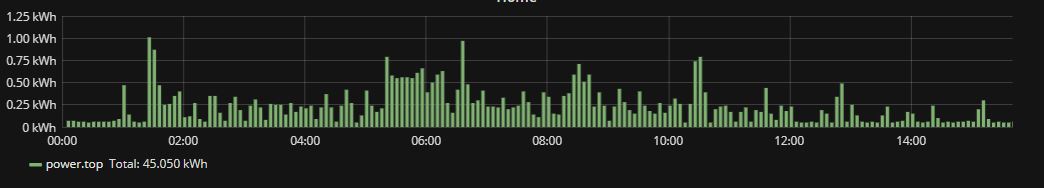
The thin client running RTL-AMR reads RF signals for kWh being broadcasted from my power meter. It allows me to graph power usage down to a few minutes. RTL-AMR collect sends the data to influxDB which I pull into Grafana.
Pfsense also pushes bandwidth to influxDB via Telegraf. The Raspberry pi uses sensu to execute checks for temp/humidity sensors and pushes them to Graphite, which is also pulled into Grafana.
1 Like
That’s awesome! Would love to do something similar with pulling power usage data into grafana.
I was using Grafana a bit about a year or two ago just for gathering server stats (cpu, ram, network info via collectd). Not sure if it was the way I set it up or if the data rate was too high, but the interface got rather clunky and I had issues loading it.
Might give it another shot in a bit, as I’d like to use it to pull in Plex usage data as well and have that visualized.
Try running it on something with a small SSD - it shouldn’t require much resources though since it’s only reading from something else, like Graphite or influx. If you’re monitoring something on 5 second intervals and don’t have any sort of retention for that, trying to view Grafana over the course of days/weeks at 5 second intervals would like slow the browser down.
For the meter itself, it has to be one that broadcasts RF signals - meter maids used to walk around scanning meters manually. Then they (they may still) drove around I believe and had a receiver to pick the signals up. I believe now, there is a RF receiver within X yards I guess from the meters to pick the signal up.
1 Like
Probably was my issue. Was running it on a server with a HDD and a bunch of other stuff running in addition. Was using influxdb with it. Pretty sure it was either 5 or 10 second intervals and I was viewing a day maybe at a time. With separate graphs for load, ram usage, network speed, latency to 8.8.8.8, etc.
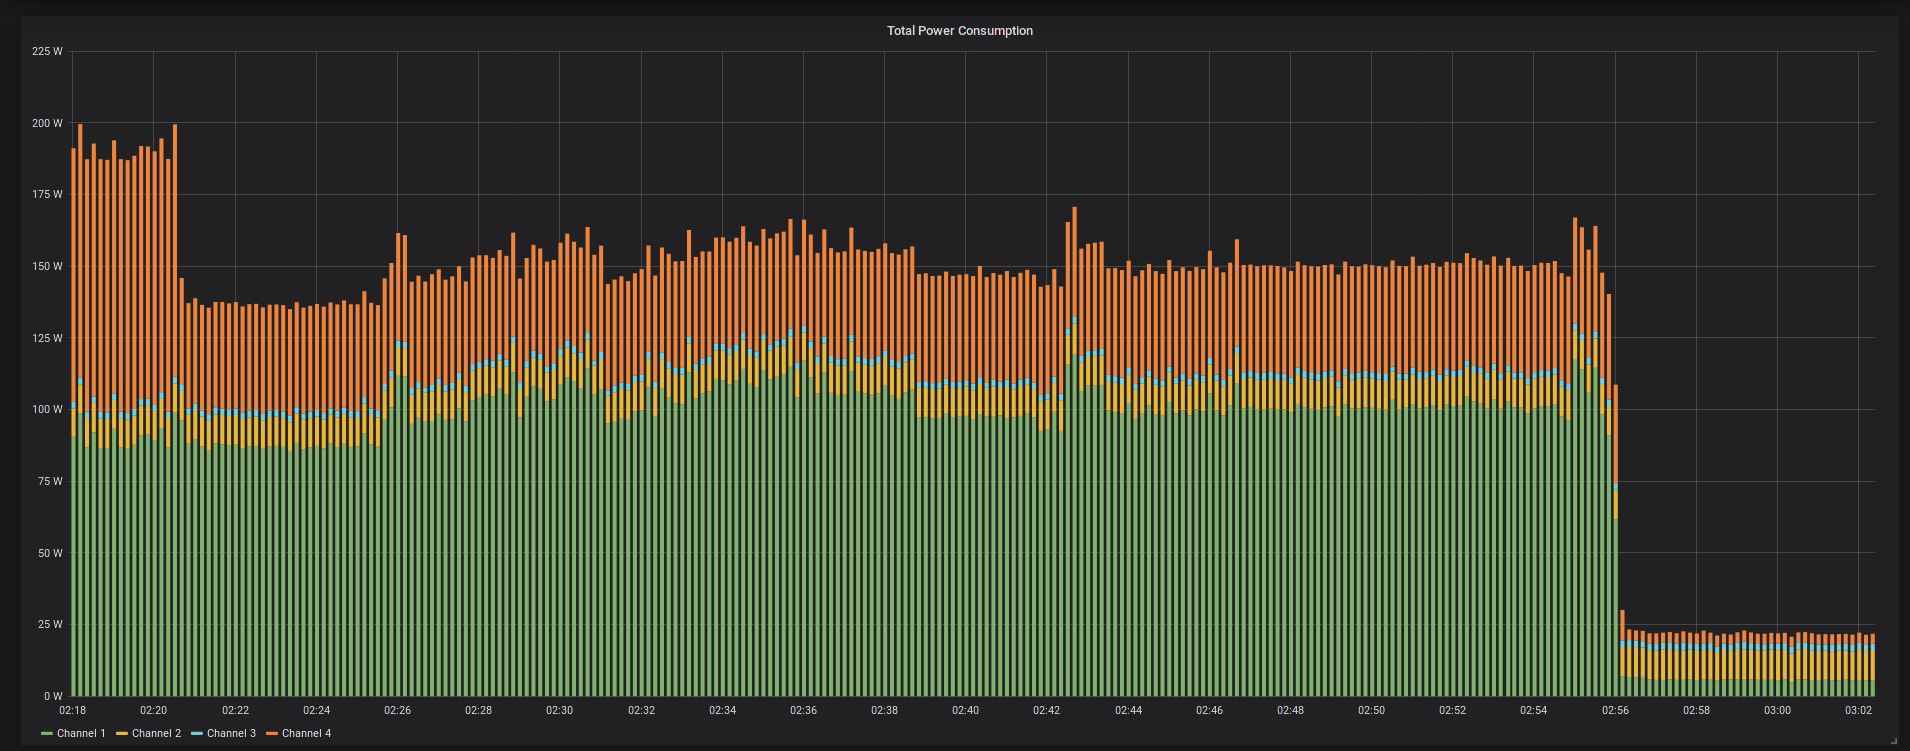
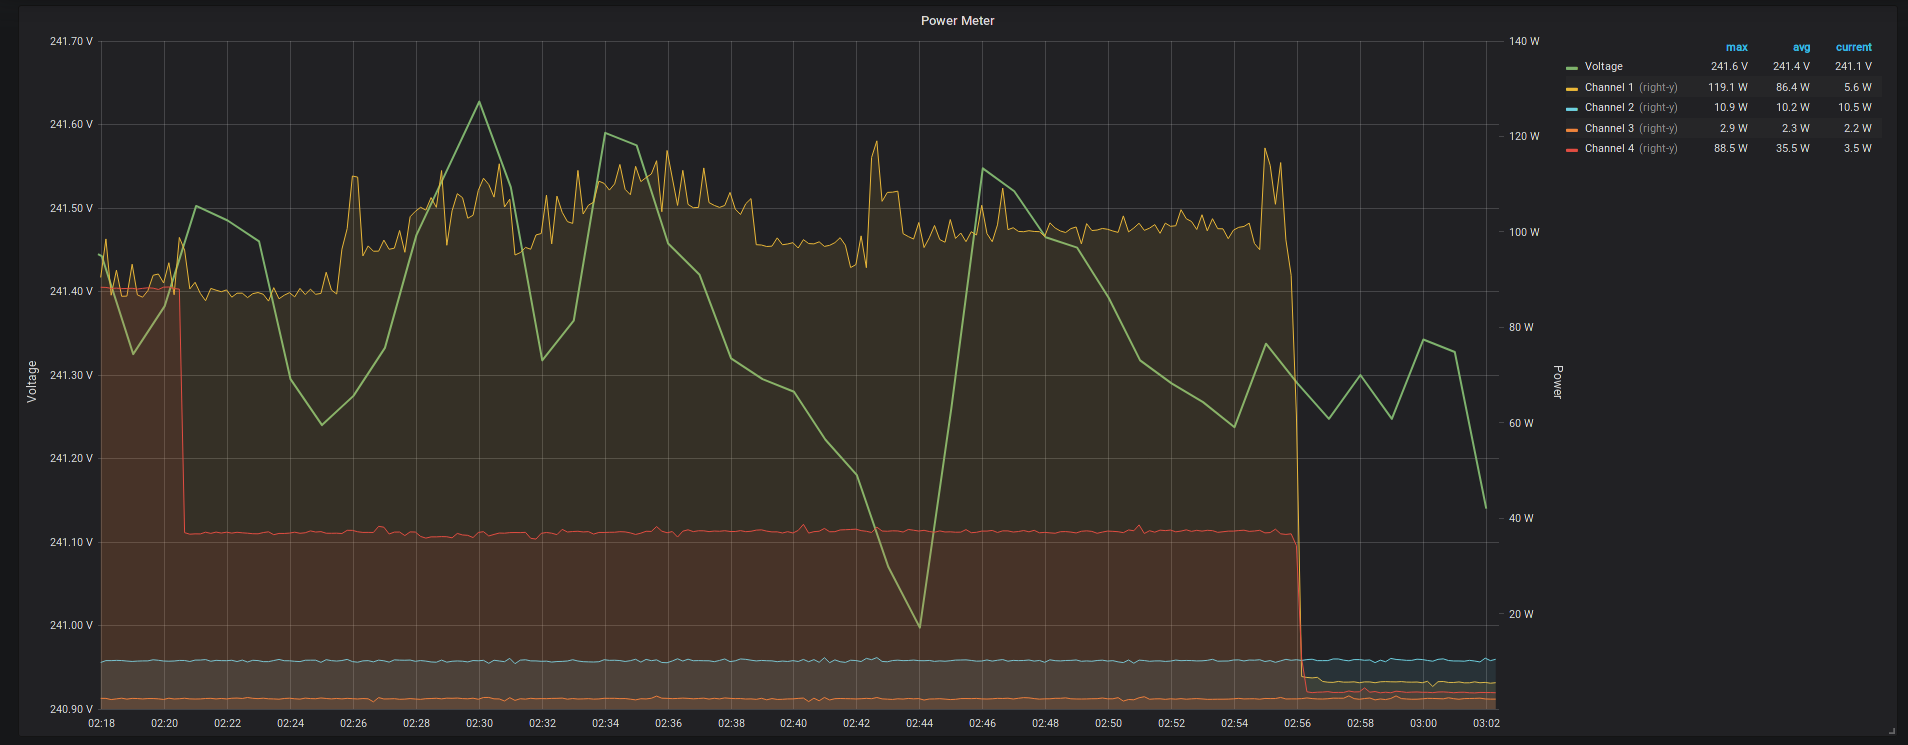
I have actually built a DIY 4 channel energy monitor. Arduino with Ethernet controller and a library called OpenEnergyMonitor is collecting data and sending it to collectd on RaspberryPi.
Collectd then sends the information to my remote InfluxDB + Grafana instance.
2 Likes
Fantastic projects guys. Really. I have read about InfluxDB anf Grafana but it seems to be too complicated for me to setup / integrate with what I need.
1 Like
It’s not too bad. There’s a ton of guides to get going. Start small and build up from there. Collectd is the easiest method (I think) to get some stats off servers.
Setting up the graphs took a little getting used to. But start small and add metrics little by little and eventually it looks nice.
1 Like
It’s really easy to setup though. InfluxDB and Grafana require almost zero configuration - well, apart from defining your dashboards and ways to display your metrics.
Then you just need some metric collector like Collectd to actually collect metrics and send them over to your database. This works via UDP and can be remote, so you can have many servers feeding data into a single database.
Another awesome thing is that Grafana can do alerts, so you can basically say “if WHMCS response time has been > 2 seconds for the past 5 minutes, send me a Slack message”
4 Likes
Interesting. I seen a few tutorials in the past but I guess it doesnt work as I want it do. I mean. Tutorials contradict each other. Definitely need to give this a try in the next weekend. I want to pull some data via API and such.
1 Like