Hey,
I’ve been trying to debug this problem since almost a week now. So, this is a cPanel server with CloudLinux and LS. Randomly server load reaches above 200 (mostly 250) and becomes unresponsive.
Things I’ve tried so far:
- Disabling SWAP
- Making sure everything’s upto date
- Scanning accounts for malwares/exploits (even with lve enabled)
Things I’m thinking to try:
- Disable CloudLinux OOM killer
- Trying Kdump
Problem is even when load is high, there are no processes using significant amount of CPU. So, I’m doubting high IO. Here is monitor log from one such event:
!-------------------------------------------- top 50
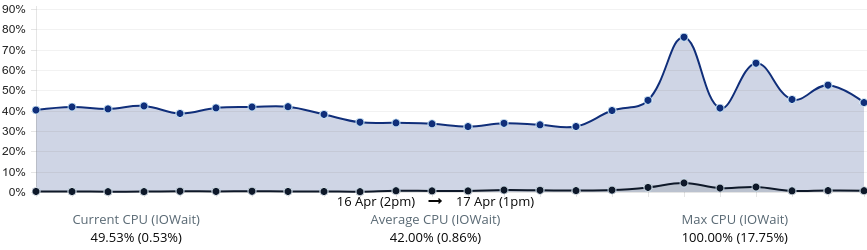
top - 04:28:10 up 3 days, 1:59, 1 user, load average: 131.37, 139.55, 102.51
Tasks: 1206 total, 270 running, 934 sleeping, 1 stopped, 1 zombie
%Cpu(s): 17.1 us, 80.1 sy, 1.1 ni, 0.0 id, 0.2 wa, 0.0 hi, 1.5 si, 0.0 st
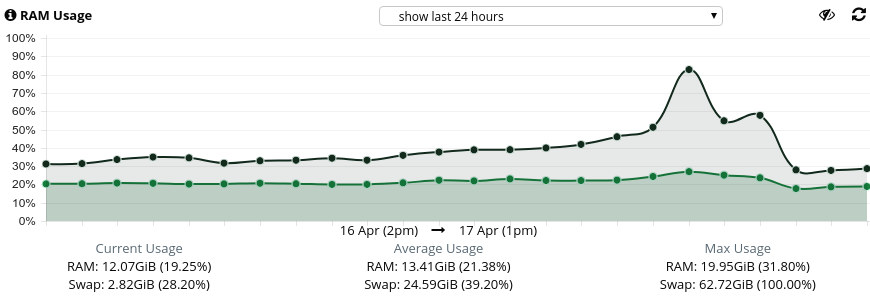
KiB Mem : 65768876 total, 1533392 free, 19082896 used, 45152588 buff/cache
KiB Swap: 10491896 total, 7776 free, 10484120 used. 34913172 avail Mem
PID USER PR NI VIRT RES SHR S %CPU %MEM TIME+ COMMAND
10245 mysql 26 6 18.7g 4.4g 3344 S 106.5 7.0 2586:18 /usr/sbin/mysqld --daemonize --pid-file=/var/run/mysqld/mys$
17068 root 20 0 271208 56792 1532 R 50.2 0.1 57:06.76 cxswatch - scanning
192 root 20 0 0 0 0 R 42.9 0.0 102:07.40 [kswapd0]
9242 mongod 20 0 1325612 249392 2772 S 37.7 0.4 367:50.58 /usr/local/jetapps/usr/bin/mongod --quiet -f /usr/local/jet$
28994 digikrea 20 0 338700 24912 3444 R 36.4 0.0 0:01.29 lsphp:/home/someacc/public_html/index.php
193 root 20 0 0 0 0 R 34.2 0.0 112:06.32 [kswapd1]
17067 root 20 0 272140 58868 1432 R 33.8 0.1 57:32.19 cxswatch - scanning
IOTOP:
!------------------------------------- iotop -b -n 3
Total DISK READ : 184.97 M/s | Total DISK WRITE : 2016.29 K/s
Actual DISK READ: 98.64 M/s | Actual DISK WRITE: 24.53 M/s
TID PRIO USER DISK READ DISK WRITE SWAPIN IO COMMAND
27604 be/4 anotheracc 0.00 B/s 0.00 B/s 0.00 % 96.25 % lsphp:/home/anotheracc/public_html/wp-login.php
28277 be/4 lyricsa1 20.52 K/s 0.00 B/s 0.00 % 53.80 % lsphp:e/anotheracc/public_html/anotheracc/index.php
28520 ?err {none} 182.79 K/s 0.00 B/s 0.00 % 10.18 % {no such process}
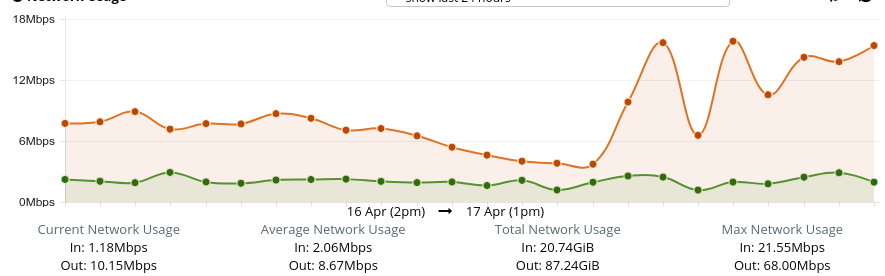
Looking at network graph spike, I’m doubting either outgoing connections or ddos. However, mostly LS admin shows mostly free http[s] connections. Another thing I found in LS logs during event is:
2019-04-16 16:54:44.881725 [WARN] Redirect destination does not specified, ignore!
# grep "2019-04-16 16:54" error_log | grep Redirect | wc -l
2002
Any pointers?