High Load Average but Low CPU Usage

I’m encountering a strange issue on one of my servers. This is on a Slice 4096 at BuyVM, which has one dedicated CPU core.

Sometimes the load spikes to around 2.0:

It seems periodic when it happens (eg. in this graph it happened roughly every 20-25 minutes). I suspected a cronjob, but I don’t have any cronjobs that run every 20 mins.

However, CPU usage doesn’t actually increase during that period:

I managed to actually see this happening while SSH’d into the server… It had a load of 1.88, but the CPU was 94% idle and there was 0% iowait (which is what I expected the cause might have been)

I’m stumped.

Any ideas what this could possibly be?

Did you watch the load average go up?, fact it’s only a short period and the 5 / 15 mins averages don’t go up much could be something that runs for a second or so but uses 100%. By time you see the load average high it’s already stopped and your just waiting for the “average” to reset.

Just an idea anyway…

I thought it might be something like that, however the second graph in my post (CPU usage) is updating once per second and there’s no spike there at all :confused:

Look at IO usage and IO latency.

Likely another VM on the same node. Check sar at the time of the spike and see if there was steal, or watch glances + 1 or top +1 for steal at the time the problem happens. If it’s disk, you may not see any steal though, so that could throw it off. If nothing is showing on your VM as the culprit, and there’s no steal at the time, even a small amount, it’s probably a disk issue.

That’s what I was thinking, but IO looks pretty minimal. There’s no sudden spikes or anything like that :confused:

The CPU graph I was looking at includes steal% which is very low. top shows steal as 0.0% to 0.4% when it happens.

Do you have fail2ban or anything like that installed? I know that can sometimes cause a load spike at it parses logs and updates ban lists.

Nope.

Plus in that case I think it would be using a lot of CPU time, rather than the CPU being 94% idle?

I’ve been staring at it since you posted, and every idea I had was shut down by another variable included.

There’s only one thing to do when fully stumped on Linux, and that’s to get schooled by @Francisco.

2 Likes

What crons do you have running?

You have it happening around every 20 minutes.

Francisco

I have Netdata up and running at https://netdata.vps03.d.sb/ if you want to mess with the graphs… Maybe you’ll see something that I missed.

I’ve got a few running every 5 minutes, and a few that run every 30 minutes. Nothing running every 20 minutes. I checked systemd timers too. Some of the spikes line up with cromjobs that run every 30 minutes, but not all of them.

This is on my VPS on BuyVM KVM-54.LV, in case there’s anything you can see from your side :stuck_out_tongue:

Is there some reason why the workload on a 5 minute cron job might be different every X amount of runs? I always try to avoid assuming that a cron does the same amount of work every time it runs.

What about the available entropy going down to almost zero every 5 minutes?
I guess some process could be waiting for /dev/random to fill up.

It shouldn’t be for these particular cronjobs. I totally disabled all the cronjobs for my user (crontab -e and commented them all out) for an hour this morning to see if that’s it. The load average spike still happened :frowning: Confirmed in /var/log/syslog that no cronjobs were executing around the time of the spike.

Good catch! I didn’t notice this originally. I installed haveged but the load spikes are still happening even with available entropy.

1 Like

So I found a 10-year-old Serverfault post about exactly the same issue, with no answer of course :angry: amazon ec2 - What could be causing load spikes on this EC2 instance? - Server Fault

Relevant XKCD:

4 Likes

I have similar load spikes on an OVH VPS of mine. In my case, it’s caused by spamassassin processing a new received email.

What you could do is run ioping and see if IO latency really doesn’t change during the spike.

In htop reconfigure it!

  1. Press F2
  2. Go to Display Options.
    image
  3. Check the “Detailed CPU Time”
  4. F10, F10 to close and then reopen HTOP.
  5. Watch for your 20 minute spike and see which color band is pegging CPU.
  6. F1 to do the help section and find which CPU color goes to which type of usage!

That’s the problem… I’m seeing load average increase, but am not seeing CPU usage increase at all. :confused:

Just watched it increase again, with no luck:

Using any disk mounts over network? Check disk i/o times and calls.

So I worked this out… Wow, that was a journey. At least now I have some interesting content for a blog post :stuck_out_tongue:

Linux updates the load average every 5 seconds. In fact, it actually updates every 5 seconds plus one “tick”

sched/loadavg.h:

#define LOAD_FREQ	(5*HZ+1) /* 5 sec intervals */

sched/loadavg.c

 * The global load average is an exponentially decaying average of nr_running +
 * nr_uninterruptible.
 *
 * Once every LOAD_FREQ:
 *
 *   nr_active = 0;
 *   for_each_possible_cpu(cpu)
 *	nr_active += cpu_of(cpu)->nr_running + cpu_of(cpu)->nr_uninterruptible;
 *
 *   avenrun[n] = avenrun[0] * exp_n + nr_active * (1 - exp_n)

HZ is the kernel timer frequency, which is defined when compiling the kernel. On my system, it’s 250:

% grep "CONFIG_HZ=" /boot/config-$(uname -r)
CONFIG_HZ=250

This means that every 5.004 seconds (5 + 1/250), Linux calculates the load average. It checks how many processes are actively running plus how many processes are in uninterruptable wait (eg. waiting for disk IO) states, and uses that to compute the load average, smoothing it exponentially over time.

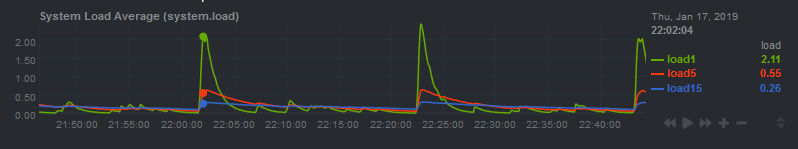
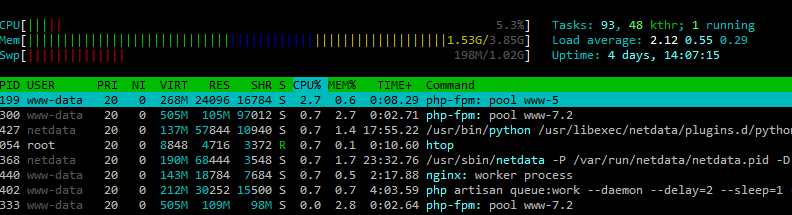
Say you have a process that starts a bunch of subprocesses every second. For example, Netdata collecting data from some apps. Normally, the process will be very fast and won’t overlap with the load average check, so everything is fine. However, every 1251 seconds (5.004 * 250), the load average update interval will be an exact multiple of one second. 1251 seconds is 20.85 minutes, which is exactly the interval I was seeing the load average increase. My educated guess here is that every 20.85 minutes, Linux is checking the load average at the exact time that several processes are being started and are in the queue to run.

I confirmed this by disabling netdata and manually watching the load average:

while true; do uptime; sleep 5; done

After 1.5 hours, I did not see any similar spikes. The spikes only occur when Netdata is running.

So… in the end… The app that I was using for monitoring the load was the one responsible for causing it. Ironic. He could save others from death, but not himself.

It turns out other people have hit similar issues in the past, albeit with different intervals. The following posts were extremely helpful:

Reported it to the Netdata devs here: Netdata causing load average increase every ~20 minutes · Issue #5234 · netdata/netdata · GitHub. In the end, I’m not sure if I’d call this a bug, but perhaps netdata could implement some jitter so that it doesn’t perform checks every one second exactly.

8 Likes