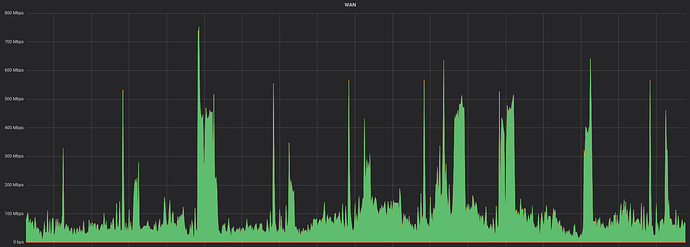
Pretty sure it’s 100Mbps of sustained 24x7 bandwidth per 4GB of ram in your slice. If you get a 32GB slice (full node to yourself) you can smack that gigabit port as much as you want.
ah… I was expecting Akon
I’d never do that to you…
What were you doing with that?
Having fun with a crawler
Hi guys what would you suggest in order to plot graphs of bw usage of some servers ?
it needs to plot bw usage and hardware resources. Something like what nix stats does but open source . Any clues ?
Munin ?
vnstat_i_ does what I want but would need a web server ( as I do not want to log in into each and see vnstat on each )
been trying to make this one work
but it wont prompt me for user pw and graphs wont render plus it makes use of apache ![]()
Munin is the easiest route.
I do love some grafana.
Grafana, influxdb, + collectd
Grafana shows the stats, influxdb stores the stats, collectd sends the stats ![]()
That is my favourite setup and what I use for all my stuff.
Grafana makes really pretty graphs, and influxdb has lots of query parameters, like being able to do 95th percentile (and not just 95th).
The problem is that a) you can play with it for hours ![]() b) it requires some processing power, both on the back end and front end (browser). Trying to work with Grafana from a phone or a tablet is painful.
b) it requires some processing power, both on the back end and front end (browser). Trying to work with Grafana from a phone or a tablet is painful.
